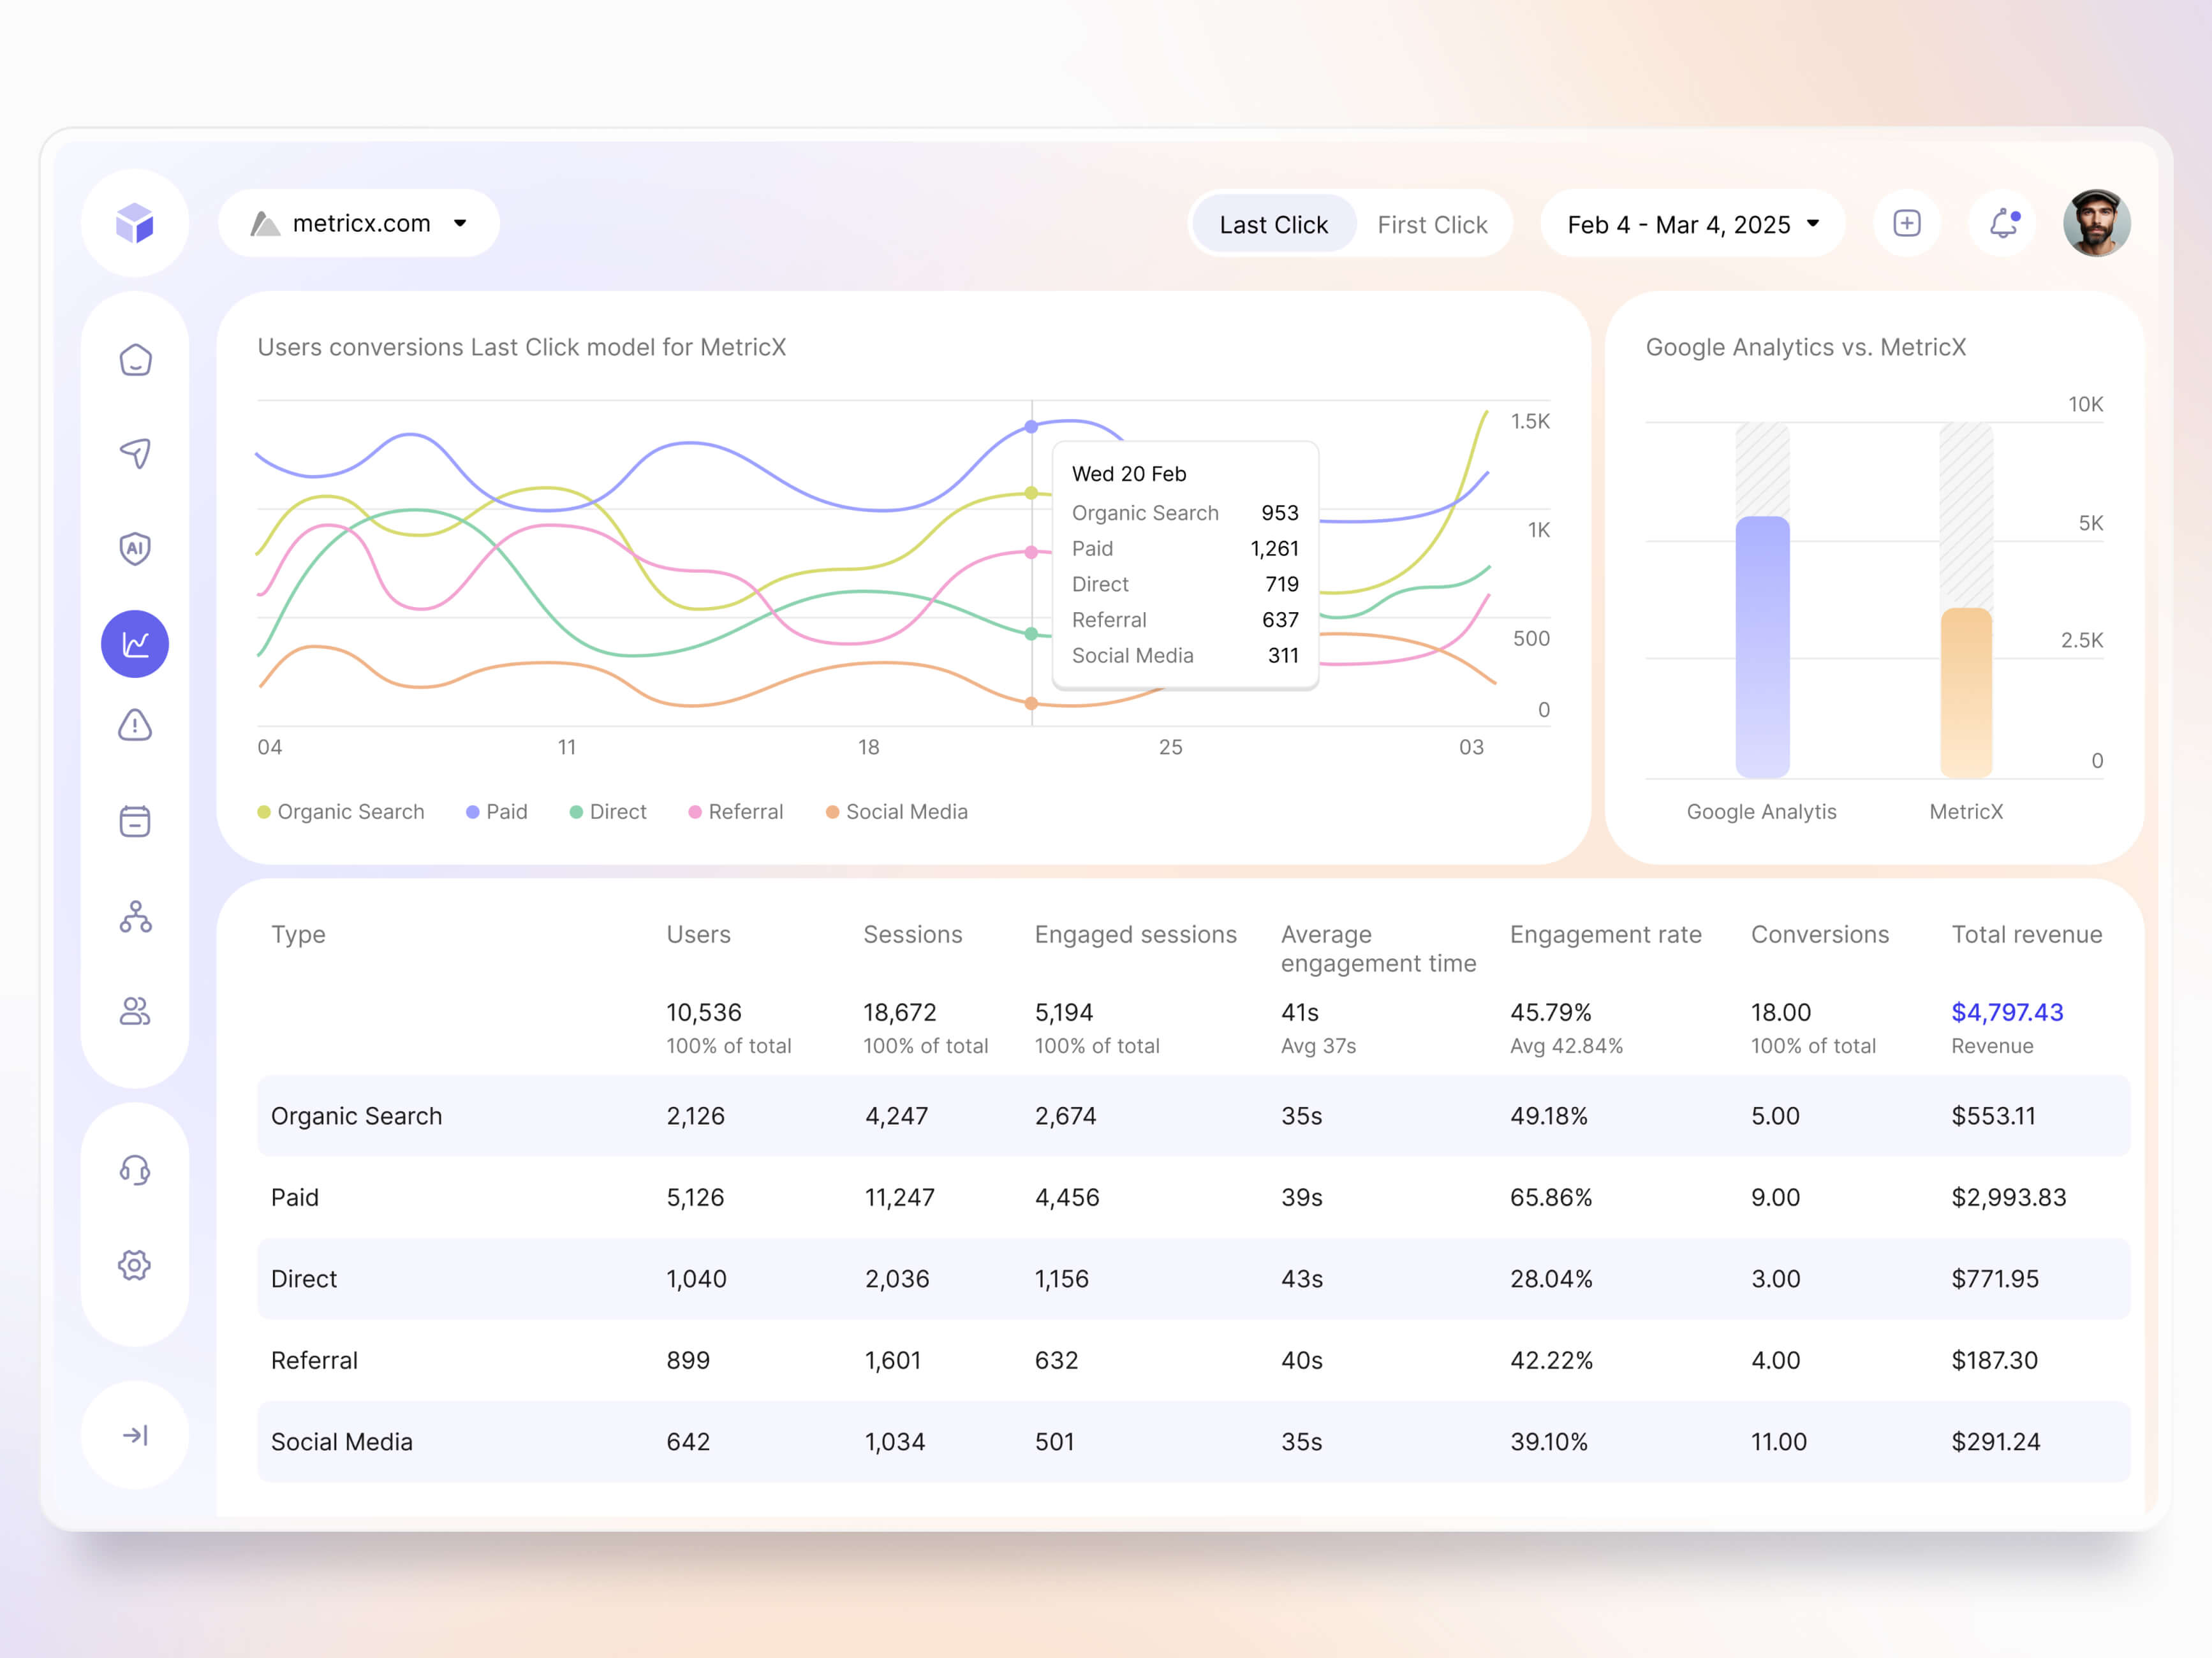
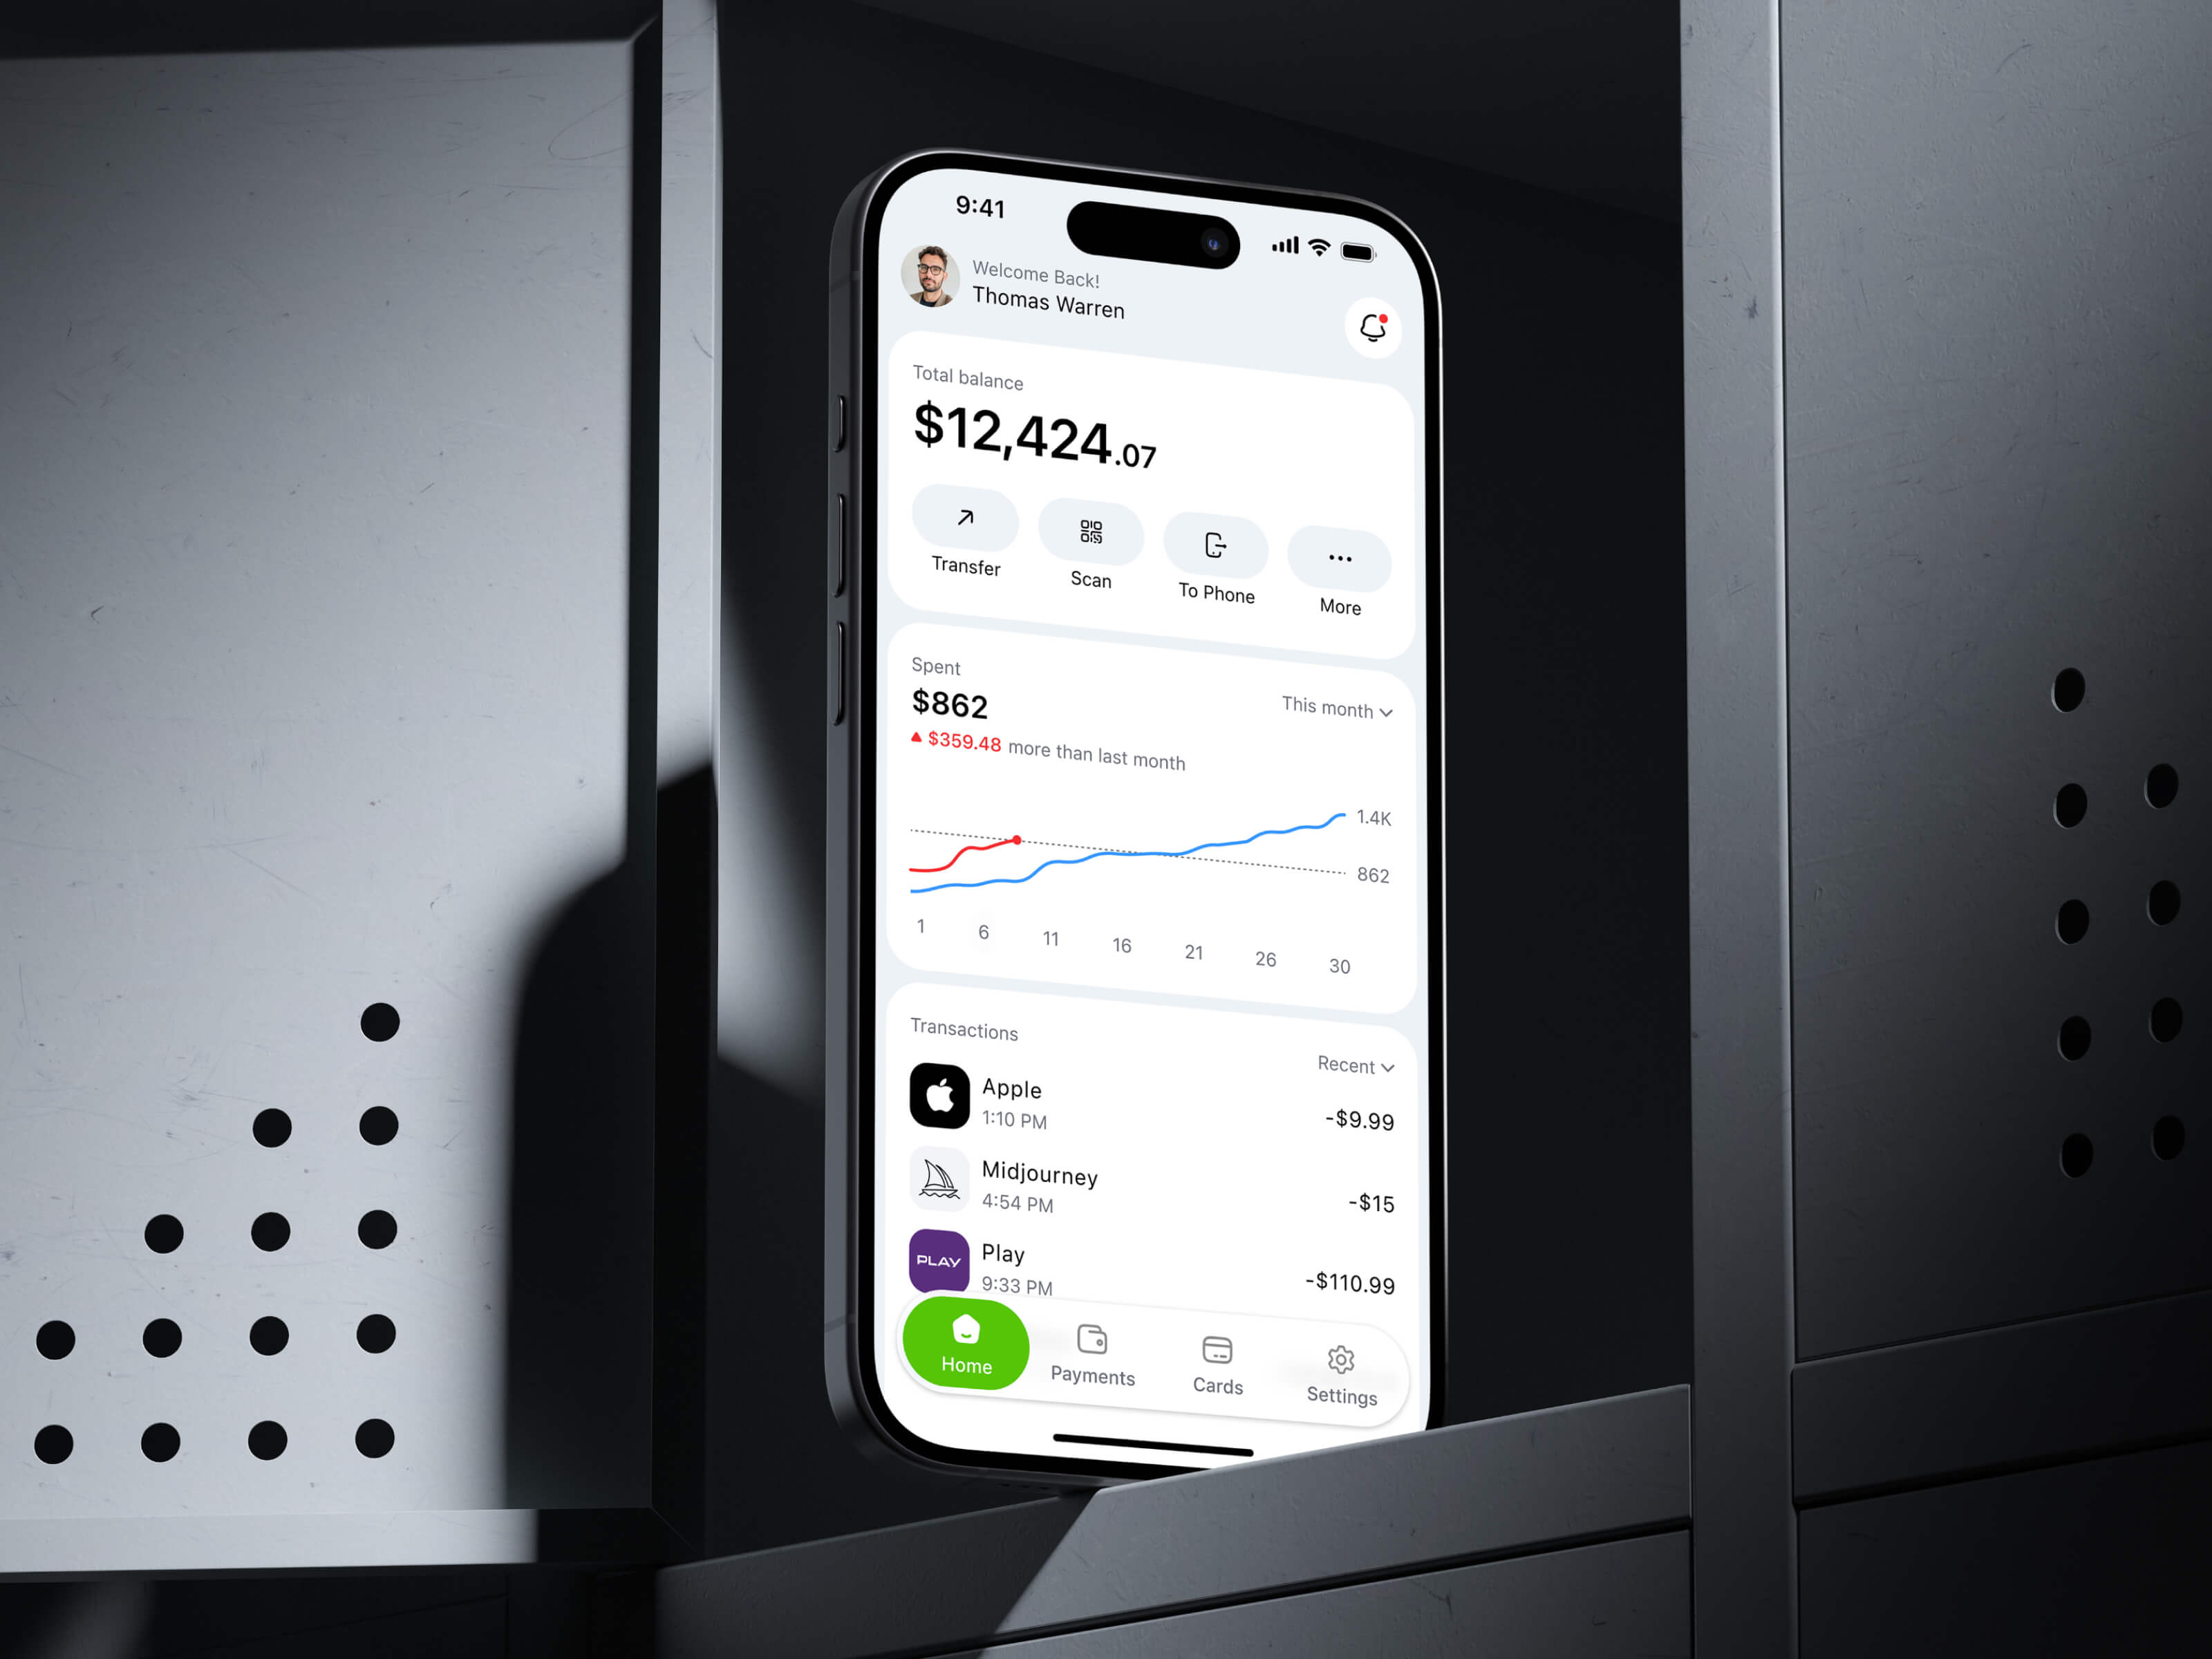
A marketing attribution dashboard concept exploring how to connect channel trends with the metrics behind them. I organised the screen around three reporting tasks: reviewing performance over time, comparing reporting sources and examining individual channels.
First-click and last-click controls keep the attribution model visible alongside the reporting period. A channel trend chart provides an overview, while the table below brings users, engagement, conversions and revenue together for closer comparison. A separate chart illustrates differences between Google Analytics and MetricX figures.
The light interface uses distinct panels and aligned data columns to structure a dense reporting workspace, with colour linking chart lines to channel labels.